Curiosity #1 — Can a retail trader vibe-code a better stock pool in Vietnam's market?
On this page
- Why I cared about the question
- What I did
- Eleven years: more growth, a shallower fall
- Year by year: more wins than losses
- Where the edge comes from: falling less
- The honest part: which gap is real, and which could be nothing
- What this test leaves out
- How a company gets its tier
- Why a "maybe" is still worth your time
- So — can a regular person vibe-code a better stock pool?
- Glossary — what I mean by the words
- How the numbers are calculated
- Change log
Curiosity #1 — a question I actually went and tested, instead of just arguing about it.
Buying "the whole market", the VN-Index, means owning hundreds of companies, the good with the bad. If a regular person with no fund and no trading floor, just a laptop and some AI-assisted code, built a pool from a few mechanical rules about size and liquidity, would it beat owning everything?
I built it and replayed eleven years of history. The answer surprised me a little, and the most useful part is the bit most backtests quietly bury.
Why I cared about the question
Most of us do one of two things with money: buy an index fund and own the whole market, or pick stocks on a hunch. A stock pool, meaning a short and deliberate list of names worth your attention, is the quiet first step of anything more serious. If a simple, see-through filter can keep pace with the market, that's worth knowing. If it can't, that's worth knowing too. I wanted the truth, not a story.
What I did
The idea is plain. Sort every company into a few tiers, the biggest and most-traded names at the top and the rest below, by a transparent size-and-liquidity rule (the exact rule is spelled out further down). Then just hold the top three tiers together, weighted by size, like a slimmed-down index fund. Re-form the basket twice a year. Then replay it across 2015 to 2025.
Two promises I made so I wouldn't fool myself:
- Judge each company by what was knowable at the time, never with the gift of hindsight.
- Measure the pool and the market the same way. Where they can't be measured the same way, say so out loud and say by how much.
And I built it at a kitchen table, no expensive terminal required. One thing has changed since I first ran the experiment: the pool grew up. It's now a rules-bound index that I call the CDX, recalculated daily under frozen rules, and every number below comes from that official series rather than my first rough cut.
Eleven years: more growth, a shallower fall
| Growth 2015–2025 | Compound annual growth | Worst fall | |
|---|---|---|---|
| The CDX pool (top three tiers) | +317.44% | +13.87% | −41.46% |
| VN-Index (the market) | +227.05% | +11.37% | −45.26% |
| VN30 (the blue chips) | +237.50% | +11.69% | −48.14% |
A note on measurement: all three series are price indices, and none of them adds dividends back. That was tested directly on 5,265 cash-dividend ex-dates, so this is a like-for-like comparison and the gap is real.
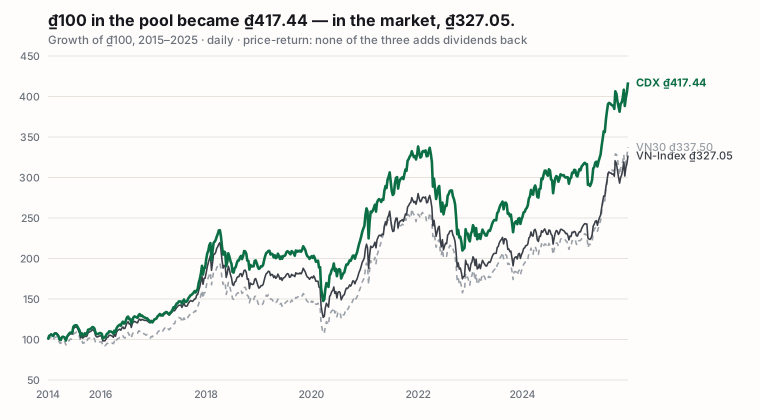
It grew more than both yardsticks, and its worst peak-to-bottom fall was the shallowest of the three. So the filter works? Almost. But the year-by-year tells the fuller picture.
Year by year: more wins than losses
| Year | CDX | VN-Index | VN30 |
|---|---|---|---|
| 2015 | +9.78% | +6.12% | −1.01% |
| 2016 | +10.73% | +14.82% | +5.48% |
| 2017 | +60.22% | +48.03% | +55.29% |
| 2018 | −3.53% | −9.32% | −12.36% |
| 2019 | +7.34% | +7.67% | +2.82% |
| 2020 | +20.22% | +14.87% | +21.81% |
| 2021 | +36.86% | +35.73% | +43.42% |
| 2022 | −33.36% | −32.78% | −34.55% |
| 2023 | +13.66% | +12.20% | +12.56% |
| 2024 | +22.81% | +12.11% | +18.85% |
| 2025 | +35.24% | +40.87% | +51.00% |
No free lunch. The pool trailed the broad market badly in 2016, clearly in 2025, and by a hair in 2019; in the 2022 crash it fell about as hard as everything else. What it did was win more years than it lost, finishing ahead of the market in seven of the eleven and ahead of the blue-chip VN30 in eight, without a single disastrous year of its own.
And 2026 so far (through July 23): CDX −4.64%, VN-Index −4.77%, VN30 −9.13%. A down year for everyone so far. I include it because honesty beats looking good.
Where the edge comes from: falling less
Look closely and CDX does not win by gaining more when the market rises; it wins by falling less when the market drops. On days VN30 rose, CDX captured about 90.8% of that gain; on days VN30 fell, it took about 87.9% of the pain. Give up a little upside, avoid a little more downside, repeat for a decade — that is the whole edge.
But a defensive claim has to report where it failed to defend, and 2026 so far is exactly such a place: CDX is down −17.12% from its peak against VN30's −16.96% — marginally worse. One incomplete year is not a verdict, but it is also not something I get to quietly leave out.
And here is where I argue against myself, before you have to. Hold only the largest tier and the pool returns +9.99% a year, which loses to VN30. The advantage only appears once the pool widens to all three tiers, at +13.87%. To be blunt about it: this method does not pick large stocks better than the index does. It is not better at all. The edge comes from breadth, not from selection.
The honest part: which gap is real, and which could be nothing
Across the whole stretch the CDX beat VN-Index by 2.50 percentage points a year (13.87% vs 11.37%). But that figure is measured from exactly one sample — eleven years — so it carries an error bar. Even after allowing for that error, the gap still sits above zero. "There was really no gap, just luck" is a hard case to make.
Against VN30 it is a different story: the gap is 2.18 percentage points a year, but once the error is allowed for, it could be zero. Said plainly: the CDX leads the broad market, and against the blue chips it is not convincing.
And here is the part that weakens my own case, which is exactly why it belongs here: that "hard to write off as luck" conclusion depends on how the index is built. The older construction, run on weekly data with no single-name cap, gave a smaller gap — and on that build, both comparisons could be zero. The gap is positive on every construction; the certainty is not. So I give you both, rather than only the build that flatters me. (The exact figures are at the end, under "How the numbers are calculated".)
There is one more question a sharp reader asks immediately: why start in 2015? Because share counts before then are indicative rather than exact. But you don't have to take that on trust — the three years I cut out, run on the very data I trust less, tell the same story: CDX 13.79% a year against the market's 11.33%. Dropping them is not what makes the number look good.
So I won't tell you "this beats the market" as something proven. I'll tell you the smaller, truer thing:
Over this decade, the pool kept pace and then some, and it rode the worst stretch a little more gently. Whether that extra is real skill or just this decade's luck, one decade can't say.
The gentler worst-case is the part I'd lean on: −41.46% at the deepest, versus −45.26% for the market and −48.14% for the blue chips. Same caveat as before — a single decade of shallower holes is thin evidence too, not a promise. But a shallower hole to climb out of is the kind of edge I'd rather own than a flashy return.
One note for anyone re-running this on weekly closes: daily data sees the intraweek lows a weekly series smooths over, so on a weekly grid every worst-fall here looks one to three points kinder, while the ordering between the three stays the same.
What this test leaves out
The two indices are not built the same way. Per HOSE's published methodology VN30 weights by free float — only the portion of each company that can actually be traded — while the CDX weights full market value with a 10% cap per name. That is a real difference, and I disclose it rather than adjust it away.
Trading costs are left out on every side. Every basket pays something to reshuffle, and none of these numbers subtract it.
The index has a 2012 base so the series runs unbroken, but I only make claims on 2015–2025. Share counts before 2015 are indicative rather than exact, and those counts drive market value, which drives who lands in which tier and at what weight. And this is a research exercise, not something you can go buy.
How a company gets its tier
No fundamentals, no opinion, no story about the business. Every trading day, every stock is graded on three things that are hard to dress up: size, liquidity, and how actively it trades. It has to clear all three, in order:
- Size — market value = that day's price × the shares actually on file that day (the real, dated share count, net of treasury shares, never today's count projected backward). Rank every company by market value and take the biggest names from the top down, until they cover the cutoff share of the market's total value.
- Liquidity — the 252-trading-day average of (price × volume). Of those, keep the ones where enough money actually changes hands, day in day out.
- Turnover — the 252-trading-day average of (volume ÷ shares outstanding). Of those, keep the ones whose shares genuinely circulate, instead of just sitting still.
The three tiers are the same screen at a tightening cutoff, and because a stock has to clear the size step first, a smaller cutoff means a stricter, smaller club:
| Tier | Size · liquidity · turnover cutoff | What it is |
|---|---|---|
| L1 | top 80% on all three | the blue-chip core, biggest and most liquid |
| L2 | top 90% (and not already L1) | the next ring of large, steady names |
| L3 | top 95% (and not L1 / L2) | the broad tradable belt |
| L4 | doesn't clear the 95% screen | not tradable, left out |
"Top 80%" means: the largest names that together make up 80% of total market value, that also rank in the top 80% by liquidity and by turnover. L2 and L3 loosen all three to 90%, then 95%.
Every stock lands in exactly one tier. The basket itself only re-forms twice a year, on the first trading day of January and July, reading the grades as they stood the day before (never with hindsight) and holding them in between. This piece holds L1 + L2 + L3 together, not just the blue-chip core.
Why a "maybe" is still worth your time
A clean "maybe" beats a confident lie. What I'm handing you isn't a stock tip. It's a method written out in full, built to avoid the three traps that make most homemade backtests fool the person who built them:
- Pretending you knew the winners in advance, using today's list of good stocks to "predict" the past. (Here, only what was known at the time.)
- Counting the same good years twice, through sloppy overlapping math. (Here, one clean, continuous track.)
- Comparing apples to oranges against the market. (Here all three series are price indices — something measured, not assumed.)
Every rule is spelled out above: the exact cutoffs, the averages, the review dates, the weighting cap. Not as an invitation to rebuild it — point-in-time share counts aren't freely available, so you'd struggle even if you wanted to — but so you can see exactly what I did, and catch me if the logic is wrong.
The rules themselves I did check: rebuilt from an independent price source, they reproduce 99.18% of the tier assignments exactly. Not 100%, because a different price source pushes a handful of names across a percentile edge. Which is to say what's written above really is the rule that produces this index, not a tidy description of it.
So — can a regular person vibe-code a better stock pool?
Yes, but "better" here does not mean richer.
The extra return clears the broad market but not the blue chips, so I won't call it a proven edge. What stands on firmer ground is a mechanical, transparent filter: it cuts the market down to names big and liquid enough to trade, it cost the holder nothing in return over the whole window, and it rode the crashes slightly more gently.
So my opinion, plainly: use it as a first filter, not as a promise. It answers "which names deserve a look", not "what to buy and when to sell" — and the second question is the one that makes an actual system.
And what would change my mind: run it on another market or another decade, and if the shallower floor disappears, I will say plainly that it was never real.
The next question, now that we know breadth is what does the lifting: why does it, and how long can it keep doing it? That's the next Curiosity.
Glossary — what I mean by the words
- TierEach trading day a company is graded only on market value, liquidity and turnover, never on fundamentals. L1 is the blue-chip core, L2 and L3 widen out to the broad tradable belt, L4 is left out; this piece holds L1–L3.
- CDXA rules-bound index of tiers L1–L3, cap-weighted, re-formed each January and July, no single name above 10%, calculated daily.
- Stock poolThe shortlist of stocks you actually consider, the first filter before any trading.
- Cap-weightedEach stock's share of the pool matches its market value, like most index funds: bigger companies count for more.
- RebalanceRe-checking and resetting the constituents and their weights on a schedule, here the first trading day of January and July. It is what HOSE does to the VN30 basket.
- Point-in-timeUsing only what was known at the time, never hindsight. That is what keeps the test clear of the two classic errors: look-ahead and survivorship bias.
- DrawdownThe deepest fall from a peak to the trough that follows it, the worst pain a holder had to sit through.
- Price-return vs total-returnPrice-return counts price moves only, while total-return adds dividends. The CDX, VN-Index and VN30 are all price indices, so they compare directly.
- Confidence intervalAny number measured from a sample carries an error bar; the confidence interval is the range the true value most likely falls in. A range sitting entirely above zero is hard to explain by luck; a range straddling zero leaves "nothing there" open.
- VN-Index / VN30The whole-market index and the index of the 30 largest companies, the two yardsticks used here.
How the numbers are calculated
Same rules on every side, and the one place the sides differ is disclosed:
- WeightingEach name's slice is its market value divided by the pool's total, but no single name may exceed 10%; the excess is spread across the rest.
- HoldingBetween re-formings the basket just sits and its level moves only with prices. At each re-forming the index is chained with a divisor so the level does not jump when the constituents change. Get that join wrong and the index is handed free return at every review, so I checked: across all 22 re-forming days in eleven years, the excess over VN-Index totals −1.3% — negative, not positive. None of the +317.44% came from the days the basket changed.
- Growth 2015–2025The index level on the last day of the window divided by the level on the first, minus 1; the window runs 31 December 2014 to 31 December 2025. For the CDX: 607.15 ÷ 145.44 − 1 ≈ +317.44%.
- Compound annual growth (CAGR)If every one of the eleven years had risen at exactly the same rate, that rate would have to be 13.87% to reach +317.44%. No real year matched it (2022 fell −33.36%, 2017 rose +60.22%): it is a smoothed rate, used instead of a plain average because a plain average flatters any run containing a losing year.
- Worst fall (drawdown)The deepest drop from a peak to the trough that follows it, measured on daily closes.
- The error bar on the gapThe gap is measured by bootstrap: 2,000 resamples in blocks of 20 days, on the two series' paired daily returns. The resulting 95% ranges — against VN-Index [+0.60, +4.72] percentage points a year, which excludes zero; against VN30 [−1.85, +5.90], which includes it. A different estimator gives 2.26 and 1.97 percentage points, with no change to either conclusion.
- Like-for-like, and measuredThe adjusted-close series the CDX uses handles splits and bonus issues but does not add cash dividends back; across 5,265 ex-dates the adjusted close shows no step at all. So all three series are price indices and nothing needs discounting from the gap.
Change log
Signed off: 26 Jul 2026, 11:24 (Vietnam time, UTC+7). Before that the piece was still being finished, including a fix to a wrong caption on the chart, which had said the CDX folded in dividends. From the sign-off onward, anything that changes what a reader sees is recorded here with its date. Once something is published I don't edit it quietly.
Curiosity #2 asks which tiers do the heavy lifting — is sharper better, or wider? That study is coming next.